
 .com - London Transport Service Vehicles on the web
An all-new version of this website is now available at www.ltsv.com/sv/. These pages are no longer being updated.
| .com - London Transport Service Vehicles on the web | |||||||
An all-new version of this website is now available at www.ltsv.com/sv/. These pages are no longer being updated. | |||||||
| Forum: | Vehicles |
| Topic: | General (Vehicle design, liveries, etc) |
| Post | Created |
By |
Replies |
| Central fleet growth charted | Fri 17/04/09, 00:42 |
2 Replies |
|
| I haven't had time to work this up into an article so I thought I would post it here. The chart below shows the size of the central fleet over the past 15 years (showing the breakdown between owned, leased, un-numbered and miscellaneous components). The figures for 2006 and 2008 are probably distorted upwards by a lack of official information, ie we had reports of new vehicles coming in but no data on vehicles leaving the fleets. As such, it can be seen that there has been fairly steady growth since about 1999, with the fleet now twice the size it was then. Figures are for April each year. Click the chart to see a larger version. 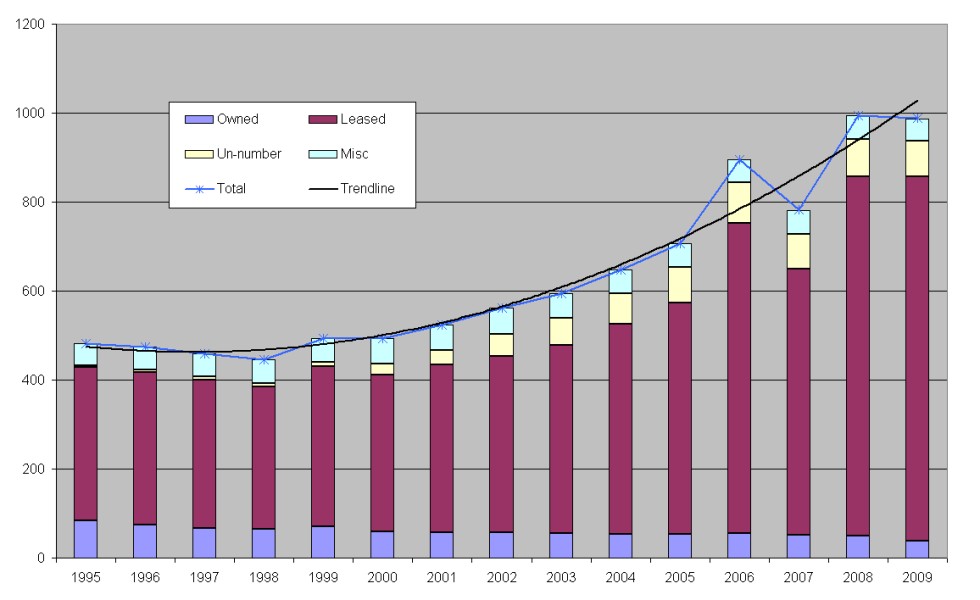 . . |
|||
| Showing Replies 1 to 2 of 2 |
Log-in to add your own reply. |
| Replies (Most recent at top) | Created |
By |
|
| More central fleet charting | Mon 23/07/12, 14:24 |
||
| With work on LTSV3 having hit another (temporary) technical roadblock, I put my 'statto' hat on last night to produce some updated charts of the central fleet. The first two show the intake of the leased fleet by plotting fleetnumbers against (approximate) dates of entry into service. They therefore update the ones that appeared in my article in 2006. The first covers numbers 6000 to 7500 and shows that the rate of intake slowed slightly during 2010 and 2011 but has now picked up again. 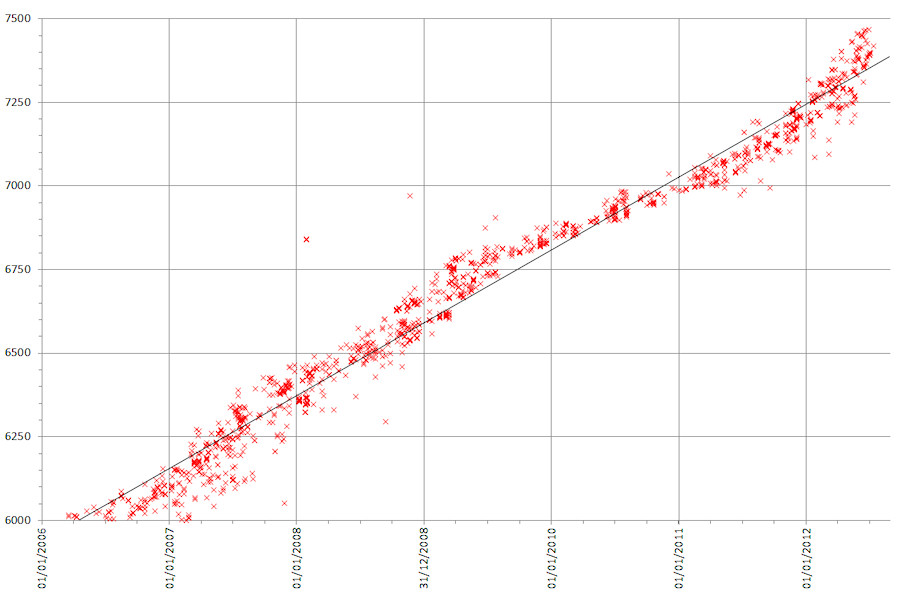 The second is the same but covers the whole leased fleet from number 3000 in 1982. 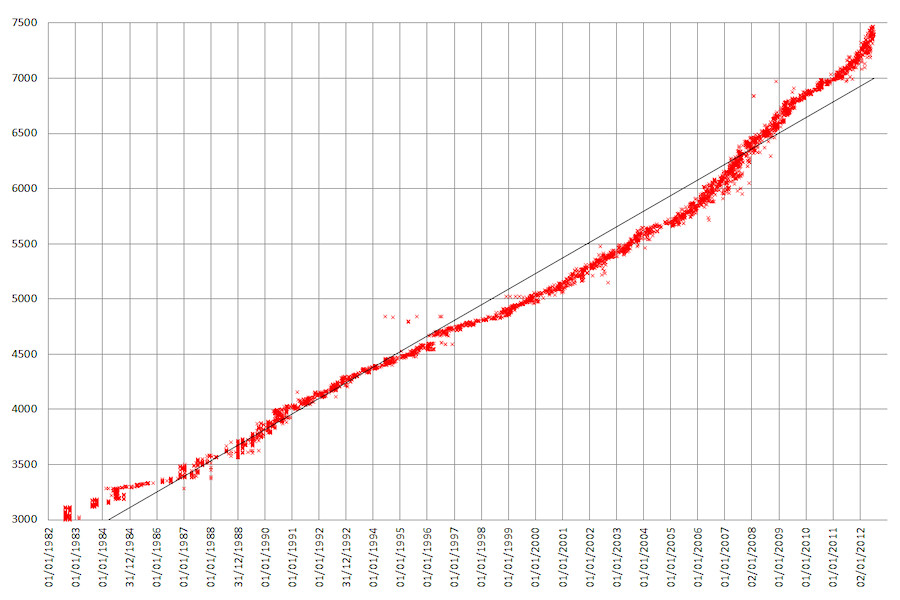 I have also updated the fleet composition chart that featured in this article back in 2004. The data is now more accurate and shows the fleet composition by make at 1st January every 4 years. Apart from the significant fleet growth since 2000, the recent rise of Peugeot and Renault are also apparent. Note that this chart does not include miscellaneous items (trailers, sweepers etc) or 'private' cars. 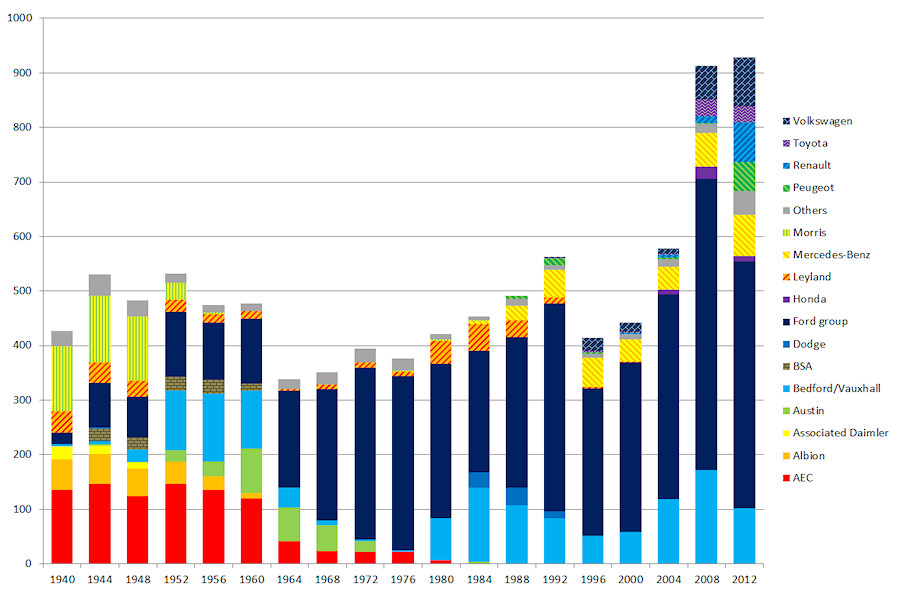 |
|||
| Central fleet size chart extended | Thu 17/06/10, 00:57 |
||
| I have expanded the chart to include figures for the years 1985 to 2010. As can be seen, it looks like the growth has peaked. Figures are for April each year. Click the chart to see a larger version. 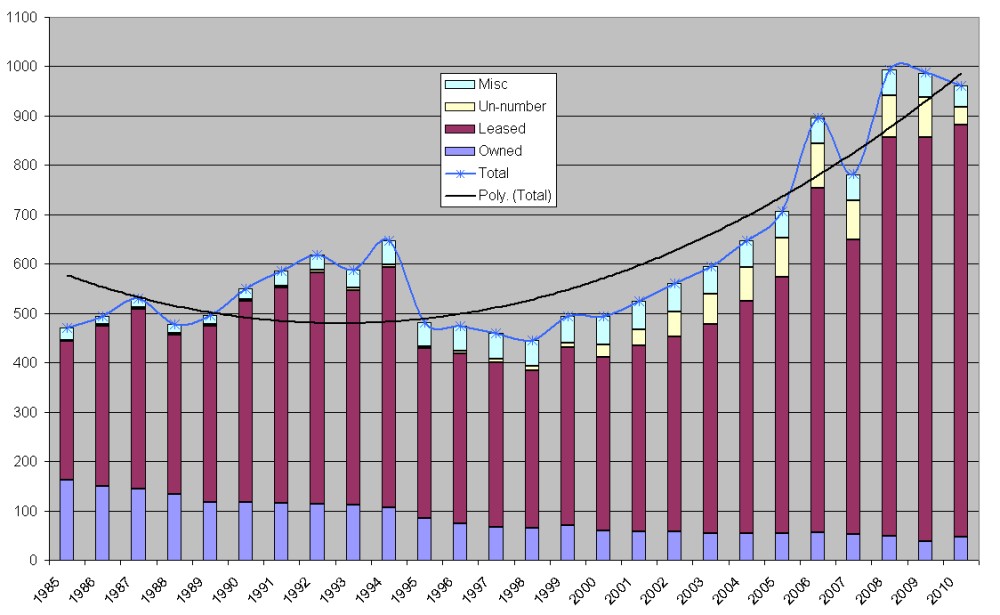 |
|||