|
View Latest Data |

|
Log-in Register |
||||||||||
| Title: | Fleet Stats |
| Summary: | An overview of the make-up of the central fleet between 1940 and 2003, with updates to 2012 |
| Category: | Statistics |
| Author: | Thomas Young |
| Posted: | 01/01/2004 |
| Last updated: | 23/07/2012 |
| Download: | |
| Content: |
Fleet Composition 1940-2003
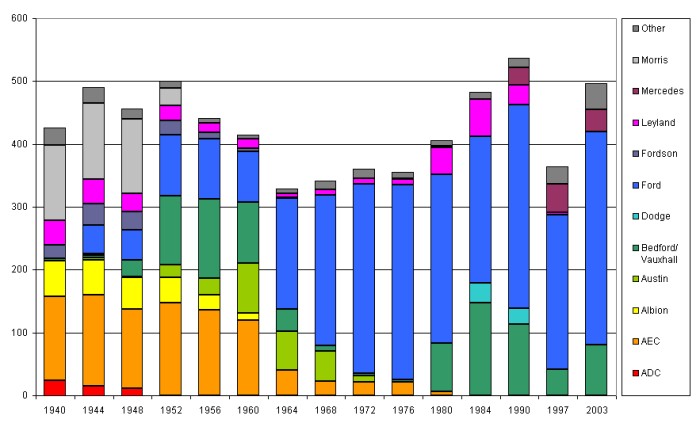 This chart is derived from data contained in the SUP-15 publication by LOTS and, for later years, the Bus Handbook series and lists on this site. As such, some of the figures are based on observations and may not be completely accurate, and the length of the time periods is not consistent. They do serve to illustrate the major trends however. Most apparent is the rise of Ford. The first (then badged as Ford Thames) were tippers bought during the war, and reasonable numbers of small vans followed. The arrival of the Trader, D-series, Transit and Escort models saw Ford become the preferred supplier, achieving almost complete fleet domination by the mid-1970s. Since then there has been a return to multi-sourcing, but large numbers of Transit vans mean Ford is still the main supplier of service vehicles today. AEC was the traditional builder of London buses, and they also supplied a good number of lorries. The chart above shows a very gradual decline in numbers with the last being withdrawn in 1984. Albion shows a similar pattern but disappears considerably earlier. Other manufacturers didn't last as long. Phases of using Morris (1940s), Bedford (1950s) and Austin (1960s) are all apparent, as is the brief resurgence of Leyland and Dodge in the 1980s. Today's fleet is therefore mainly Ford, with Bedford (now Vauxhall) as an alternate, and Mercedes preferred for larger vehicles. The overall fleet size shows considerable fluctuation around an average of about 400. The large drop between 1990 and 1997 is due to the privatisation of the bus fleets, while increased maintenance requirements on the underground and the increase in the use of leased vehicles potentially account for the general fleet expansion since the 1970s. Central Fleet Growth - 1995-2009
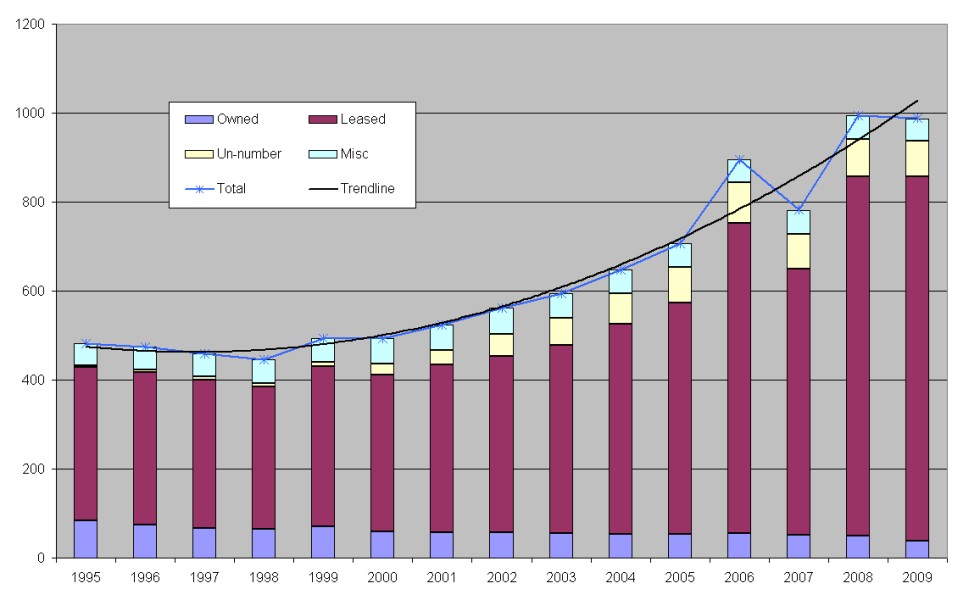 The chart above shows the size of the central fleet over the past 15 years (showing the breakdown between owned, leased, un-numbered and miscellaneous components). The figures for 2006 and 2008 are probably distorted upwards by a lack of official information, i.e. we had reports of new vehicles coming in but no data on vehicles leaving the fleets. As such, it can be seen that there has been fairly steady growth since about 1999, with the fleet now twice the size it was then. Figures are for April each year. Central Fleet Size Chart Extended
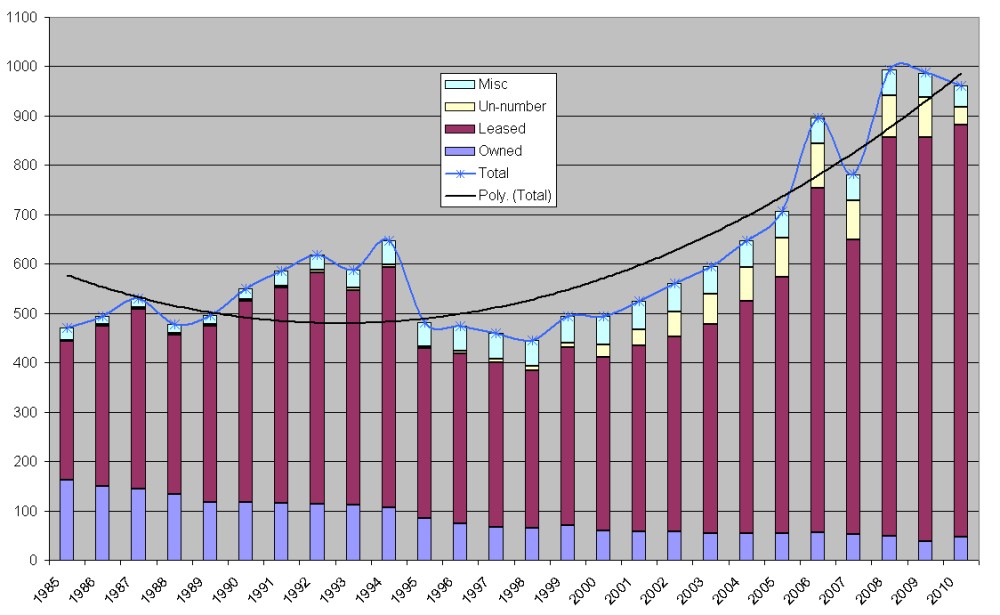 I have expanded the chart to include figures for the years 1985 to 2010. As can be seen, it looks like the growth has peaked. Figures are for April each year. Central Fleet Size Chart updated again
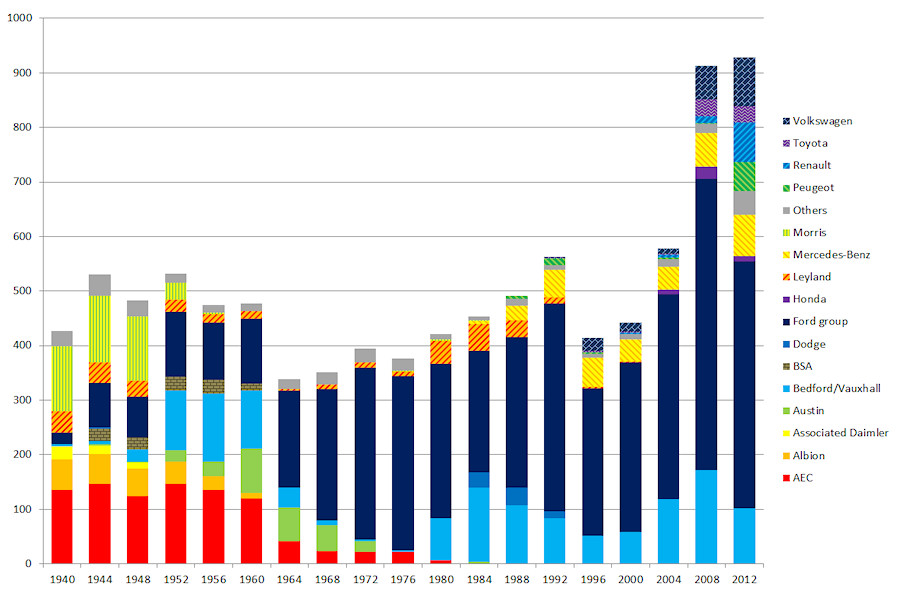 I have updated the fleet composition chart that featured in this article back in 2004. The data is now more accurate and shows the fleet composition by make at 1st January every 4 years. Apart from the significant fleet growth since 2000, the recent rise of Peugeot and Renault are also apparent. Note that this chart does not include miscellaneous items (trailers, sweepers etc) or 'private' cars. |